newquayweather Pachanga
16°C
Porth, Newquay, Cornwall. UK


Weather Warnings
audio play Met Office warnings for South West England
Met Office warnings for South West England

Weather warnings of severe and extreme weather from the Met Office

Newquay Weather Webcams
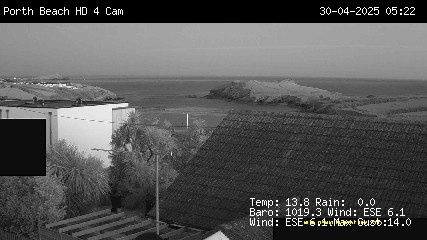
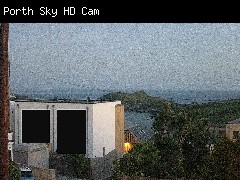
Live HD Beach Cam Live Beach Cam 2 Live Beach Cam 3
Timelapse Last 8 images Both Cams Cam 2 Last 8 images Last 8 images
Live Wide Angle Cam Newquay Cams Cornwall Cams
Timelapse Last 8 images Images Snaps update every 10/10/15/15 mins. Webcams Updated 27/06/2020 - falriver ferries
Newquay Weather Latest News

Whats New or Important

03-12-2024 - Newquayweather is now available on BlueSky - link on side panel

METRIC | IMPERIAL
Updated: 01/05/2025 @ 08:00   (0 sec ago)
Temperature Current Conditions   audio play Forecast / Rain Radar
Currently Outside: Warmer 2.8°C than last hour.

16.4°C

---
High Today
16.5°C
07:51
Low Today
12.0°C
04:21
Yest High
25.8°C
13:45
Yest Low
13.2°C
06:18
Sta* High
17.0°C
2023
Sta* Low
2.0°C
2021
* This Station's Records Since 5/2007
Mostly cloudy, Dry Mostly cloudy, Dry

Wind from NNE Wind:  NNE
0.3

Gusting to:
1.0 mph
Current Rain Rain:
0.0 mm
Pachanga
Thursday
Mostly Cloudy, Scattered Showers
Thursday night
Mostly Cloudy, Showers
Friday
Mostly Cloudy
Mostly Cloudy
22.7°C 13.0°C 16.3°C
Dew Point Liquid Precipitation Wind Speed Sun/Moon
Current: Increased 1.6°C since last hour. 9.8°C
Last Hour: Increased 1.6°C since last hour. +1.6°C
High 07:51: 9.9°C
Low 03:14: 6.2°C
Record High: 21.7°C on
7-Sep-2023
Record Low: -34.9°C on
30-Apr-2022
Wetbulb: 12.9°C
Rain Today
rain graph

Today: 0.00 mm
Yesterday: 0.00 mm
Last 7 Days: 8.80 mm
May Rain: 0.00 mm
May to Date
  Avg:10
2.10 mm
May to Date
  Diff from Avg:10
Under 2.1 mm for the month 2.10 mm
May Avg: 45.00 mm
Diff from Avg: Under 45 mm for the month 45.00 mm
Season:1 307.6 mm
YTD
  Avg:11
289.00 mm
YTD
  Diff from Avg:11
Over 18.6 mm for the year 18.60 mm
Last Rain
Time/Date:
26-Apr-2025
at 04:51
57 rain days in 2025
0 days in May
4 days since last rain
Current: NNE  0.3 mph
1Hr Average: 4.6 mph
Wind Run: 11.02 miles
Wind Gust
Current: 1.0 mph
Today: 10.4 mph 06:55
Month: 10.4 mph 1-May
Year: 55.2 mph 6-Jan
Record Gust: 70.0 mph
7-Dec-2024
Sunlight:
14 hrs 45 min
46 sec
of Sunlight Today
Which is
3 min 22 sec longer than
yesterday
(Noon ?>) graph (Midnight

Waxing Crescent
Waxing Crescent, 3 days, 11 hours, 39 minutes in cycle
16%
Illuminated
Sun Spots6
 
Sunspots Yesterday
Sunspots
77
Humidity Barometer
Current: Decreased 5% since last hour. 65%
Last Hour: Decreased 5% since last hour. 5%
High 06:43: 72%
Low 07:41: 64%
Record High: 100%
13-May-2007
Record Low: 0%
8-Sep-2015
Current: No Change 1014.3 hPa
Last Hour: Steady
High 01:02: 1016.9
Low 07:35: 1014.1
Record High: 1049.1 hPa
20-Jan-2020
Record Low: 954.6 hPa
2-Nov-2023
Heating Degree Days Snow3 Wind Chill Newquay Radiation
Today: 1.7
May: 1.7
2025 to Date: 1128.6
Cooling Degree Days
2025 to Date: 0.9
Today: 0.00 cm
Yesterday: 0.00 cm
May Snow: No Change 0.00 cm
May Avg: 0.00 cm
Diff from Avg: 0.00 cm
Season Total:2 0.00 cm
Snow Depth: 0.00 cm
0 snow days in May
0 snow days this season.2
Average 1st Snow:
0
Current: 16.4°C
Low 04:21: 12.0°C
Yesterday: 13.2°C
Record: -12.4°C
1-Mar-2018
radiation
15 uR/hr
08:10
01/05/2025

Radiation data supplied by GM-10
UV Summary/Forecast Current Solar Energy9
May-01

6.1
May-02

5.3
May-03

5.5
148 W/m2
50%
W/m2 SI
High Today:
07:24
155  W/m2
Record:
1343 W/m2
Almanac Irrigation Index5 Station All Time Records Cloud Level
Currently: Morning
YTD Avg Temp: 8.9°C
Sunrise: 05:55
Sunset: 20:40
Moonrise: 08:02
Moonset: 00:48
Full Moon: 12-May-2025
New Moon: 03:03 UTC
27-May-2025
Updated at Midnight
Current ET: 1.10 mm
7-Days Rain: 8.80 mm
7-Days ET: 24.40 mm
7-Day:  15.6 mm water in deficit of what evaporated in last 7 days. 15.6 mm
May: No Change 0 mm
Support this Site!
Your donation helps support this site
Here's How

Donate
via PayPal
Advertise
Your business

HIGHS: LOWS:
32.4°C
12-Aug-2022
-4.5°C
3-Feb-2012
Daytime Records
  30.2°C°C
19-Jun-2017
  -4.5°C°C
03-Feb-2012
Nitetime Records
  25.6°C°C
19-Jul-2022
  -3.7°C°C
01-Mar-2018
ICN:3 | S3C2:1 | Ajax 3.xx
ISS:Ok | CON:4.7 | RCP:100%
# WIND - Sheltered position when wind blows from SE through S to SW.   1 Rain season: Jan 1st to Dec 31st.   2 Snow season July 1st to June 30th.   3 Snow manually measured usually around 7AM and 7PM.   5 Estimated amount of water needed to replace the water used by plants and evaporation from the past week. (Negative numbers mean amount of water needed, positive numbers mean excess water is present).   6 Sun Spots - Data from WDC-SILSO, Royal Observatory of Belgium, Brussels.   9 Solar Index represents either an absolute scale of solar energy (W/m²) using the station’s recorded maximum or a percentage of computed theoretical solar maximum using the station’s location and time of day. These indices differ most when the sun is low on the horizon. The current scale is shown, and will toggle if it or the icon is clicked.   10 Historical average only to day 1 of just the month of May for this station since 2008.   11 Historical average rain this season to day 1 of May for this station since 2008.
 Aerisweather Weather Forecast  -   Outlook Thursday & Thursday night
Thursday
Mostly Cloudy, Scattered Showers
22.7°C
Aerisweather forecast: Mostly Cloudy, Scattered Showers. Chance of precipitation 20%. High: 22.7°C. Wind ESE 8->23 mph. UV Index 4. rain ≈ 0.1mm.
Local station forecast: Increasing clouds with little temp. change.
Thursday night
Mostly Cloudy, Showers
13.0°C
Aerisweather forecast: Mostly Cloudy, Showers. Chance of precipitation 20%. Low: 13.0°C. Wind SSE 7->11 mph. rain ≈ 0.5mm.
 Aerisweather Short Term Weather Forecast
Friday
Mostly Cloudy
Mostly Cloudy
Friday night
Mostly Cloudy
Mostly Cloudy
Saturday
Mostly Sunny
Mostly Sunny
Saturday night
Mostly Clear
Mostly Clear
Sunday
Mostly Sunny
Mostly Sunny
Sunday night
Mostly Clear
Mostly Clear
Monday
Mostly Sunny
Mostly Sunny
16.3°C 12.1°C 15.9°C 9.3°C 15.3°C 7.6°C 11.9°C
Animated icons courtesy of www.meteotreviglio.com.
  Solar PV Generation - ONLINE    audio play Newquay Air Quality PurpleAir [Particulate] Newquay Air Quality EGG [ NO2 / CO ]
solar pv

Air Quality Index


52
 
Good
Wind : NNE
01-May-2025 07:56 BST
Click for Newquay PurpleAir Page
Click for PurpleAir Website
Last Update 01 May 2025 07:08   GMT
Nitrogen
Dioxide (NO2)
92 ppbCarbon
Monoxide (CO)
0 ppm
Sensor: Wicked Devices, Air Quality Egg
Air quality to be taken as an indication only
Newquay RNLI - Recent Launches Newquay Tides Search and Rescue Helicopters

Newquay Lifeboat
Recent Launches

Time Date
9.35pm 30 April 2025
8.33pm 30 April 2025
7.12pm 29 April 2025
11.49pm 27 April 2025
11.34pm 27 April 2025
5.17pm 27 April 2025
9.50pm 16 April 2025
12.26pm 27 March 2025
9.30am 27 March 2025
2.54pm 26 March 2025
9.27pm 17 March 2025
1.32am 13 March 2025
1.23am 13 March 2025
1.04am 13 March 2025
6.58am 9 March 2025
RNLI- Newquay Station

Todays Tides

Search and Rescue Helicopters

Last Update 01 May 2025 07:09:04 GMT
MMSI111232511111232526111232513
LATITUDE---
LONGITUDE---
SPEED/HEADING0 kts / 0°0 kts / 0°0 kts / 0°
MAP---------
MessageNo DataNo DataNo Data
ajax-dashboard6.php - Version 6.95h - 20-Feb-2023 - Script by: Scott of BurnsvilleWeatherLIVE.com
Now supported by Saratoga-weather.org Download


 Weather Definitions, Weather and Earth Facts  
Fact 3 - DEW POINT
Dew point is the temperature to which air must be cooled for saturation (100% relative humidity) to occur. The dew point is an important measurement used to predict the formation of dew, frost, and fog. If dew point and temperature are close together in the late afternoon when the air begins to turn colder, fog is likely during the night. Dew point is also a good indicator of the air's actual water vapour content, unlike relative humidity, which takes the air's temperature into account. High dew point indicates high vapour content; low dew point indicates low vapour content. In addition a high dew point indicates a better chance of rain and severe thunderstorms. You can even use dew point to predict the minimum overnight temperature. Provided no fronts or other weather pattern changes are expected overnight, the afternoon's dew point gives you an idea of what minimum temperature to expect overnight.

No record breaking weather as of 01/05/2025 08:00